What is candlestick chart?
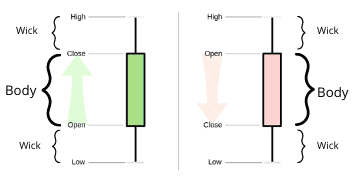
A candlestick chart looks like below picture. It has 5 parts Open, Close, High, low, Color. There is a continuous fight happening between BULLS and BEARS. As part of our analysis, we want to find out who is winning.
 For a single candlestick Open is the point from where this push pull started. Close is the point where it end. High and Low are the extreme points.
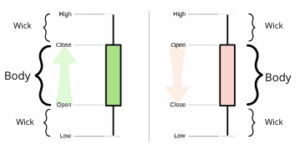
If Close is above Open , then candle body color is GREEN else it would be RED. Green body candle indicates BULLS won for that specific time. Red body indicates BEARS won.
For a candle as encircled in this picture 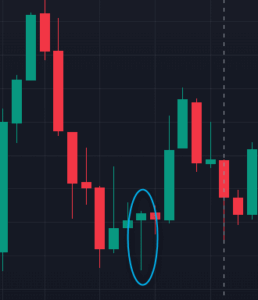 where Close is just above Open and with a deep Low but small High . This indicate BEARS tried a lot but failed and settled with a loss . This indicate BULLS are in control and that is why we see a follow through. It does not matter what this candle is called “Hammer” or “Hanging Man”. Similarly in next picture you can see a down trend has end as BULLS did not allow it to close below last RED candle close.
 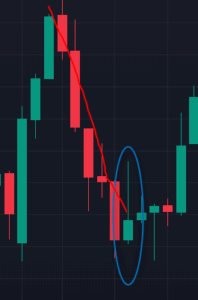 the long upper wick indicate that BULLS tried to close above previous RED candle open, but failed.
Leave a Reply